

Infographics are a visual and graphical representation of complex data; used to engage the audience for compound content delivery. That makes it easier for people to understand and grasp. The only drawback with infographics is that they look easy to make, but usually that is not the case. Over the years, the formula for infographics has been worked upon. Many websites and professionals use infographics tools for representing data on their web sites including professional Wikipedia editor.
It requires research, collecting and compiling data and the laying it out logically, for later visualizing content to add for better deliverance. There are online free host tools available to use for the matter. Following is a list of infographic tools broadly used and recognized.
1. Canva:
Canva is an infographic tool highly preferred and appreciated by people coming from a non-designer background. Due to the extensive collection, it provides along with free photos, fonts, icons, and layouts. It allows you to make informal presentations, advertises and flyers. Furthermore, you can edit and re-edit your presentation and save it.
Canva has more than two million resources you can choose from most of the images are either free or cost $1 for a single user license. It is free for most of its features, but then some of the premium features are open to paid users.
It also provides an app by the name Canva iPad that can be used on the go. Which is available for Android phones and tablets as well; the simplicity of this app allows you to work faster and better.
Infographics are not the only thing Canva allows you to create. Canva provides you with a wide range of free templates for dozens of different graphic design set-ups.
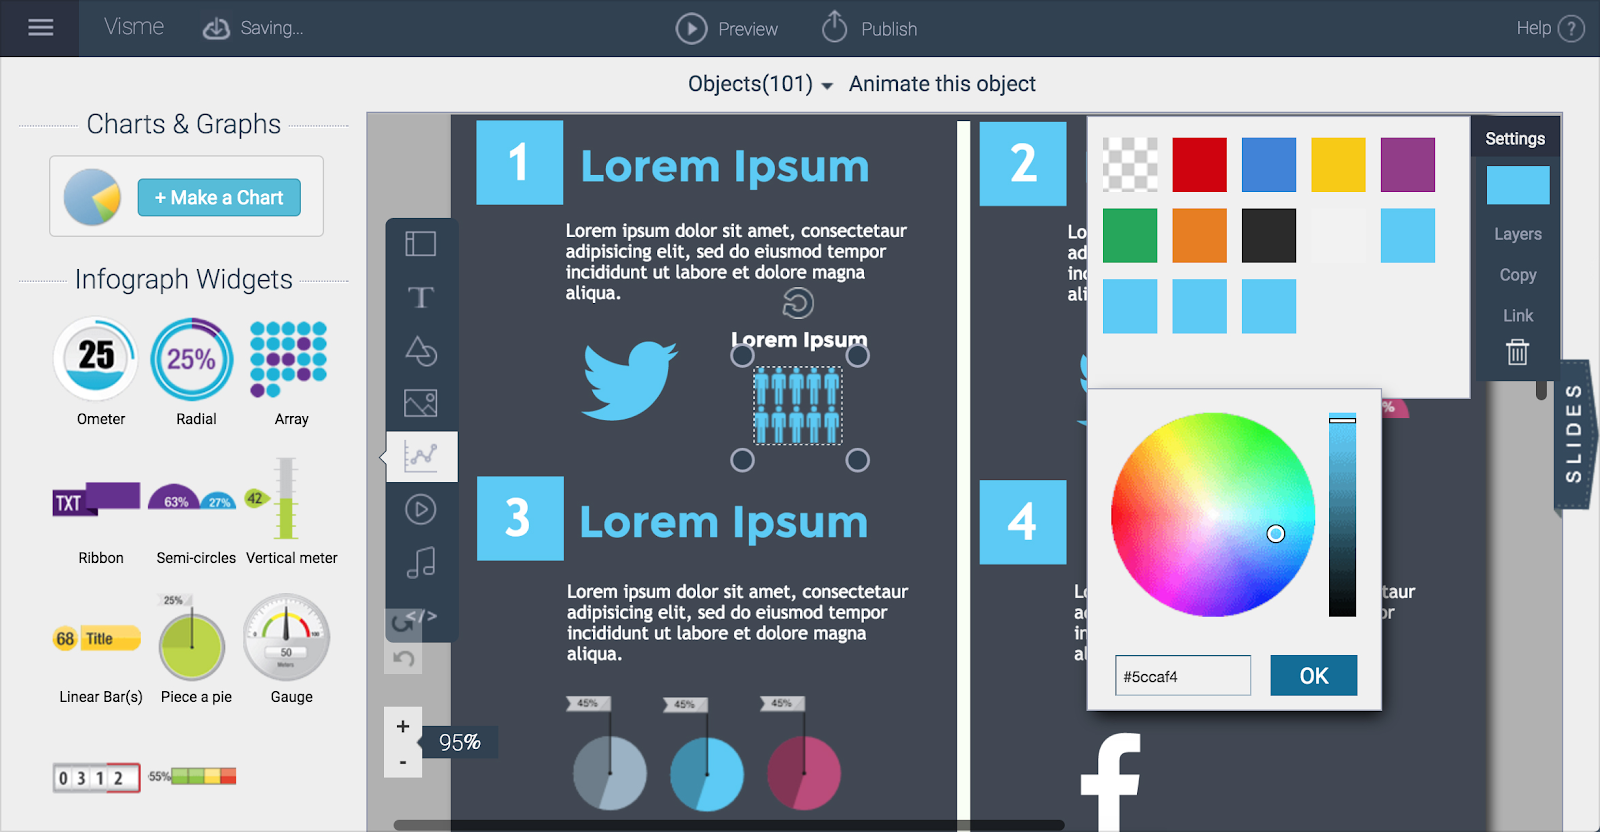
2. Visme:
Visme is a multipurpose tool, used for designing heavy infographics. If you are looking for more than just a simple template, then you should try using this tool.
It uses a build on a block system. The best way to work using Visme is to create your infographic from scratch using blocks. Finding the perfect infographic template is quite tricky, creating a blank template and then going over the suggested content section to look through the blocks for stats headers graphics and diagrams is a better option. After finding something relevant, you can customize it according to your requirement. You can do this after making your account.
Visme allows you to import content from other websites and apps. You can import flowcharts and graphs. Moreover, if you are not sure about creating your infographic then you can delete and edit parts of the already available template, it is more comfortable as it is a built on a block framework. This is easier than creating and then editing an entire template as you do at canva.
.The free plan gives you access to five projects, but there is a limit to, and you can only download your infographic as a JPG file. For downloading your data as a PDF, to get access to premium templates, you will have to sign up for the standard plan that costs $14/month.
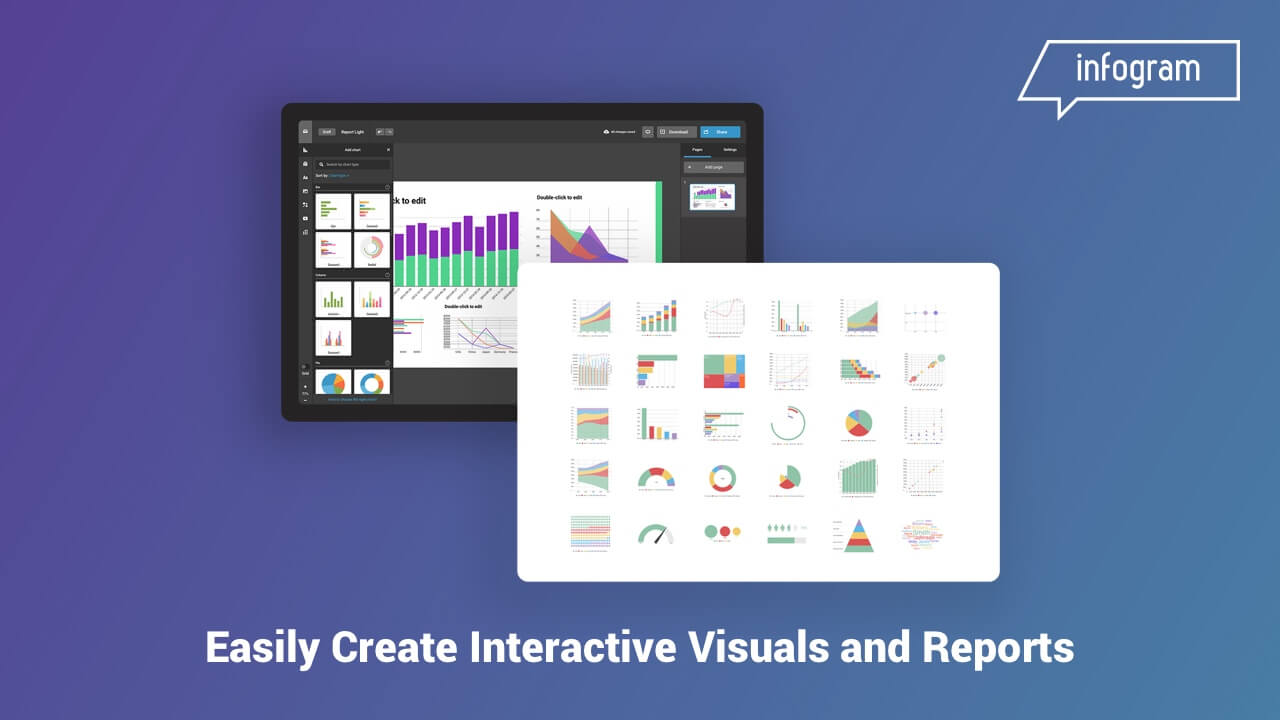
3. Infogram
Infogram provides a wide variety of charts, graphs and maps as w3ell as an option to upload pictures and videos to create decent infographics. You can sign up for an account and Use the left sidebar to navigate through all the available templates for charts, text, and graphics Then use the right toolbar to add data, edit the styling, and finalize the placement.
Also, read: Designing An Infographic Which Stands Out From The Crowd
The templates available on infogram are simple and basic. You can edit and enter data using an excel styled tool. The contents of which will be reflected in your graphs. The look of the infographic will automatically change to provide a better represent your data. Infogram is used for data visualization
The primary use of infogram is free for all however, the scales move high depending upon the type of work you are using it for.
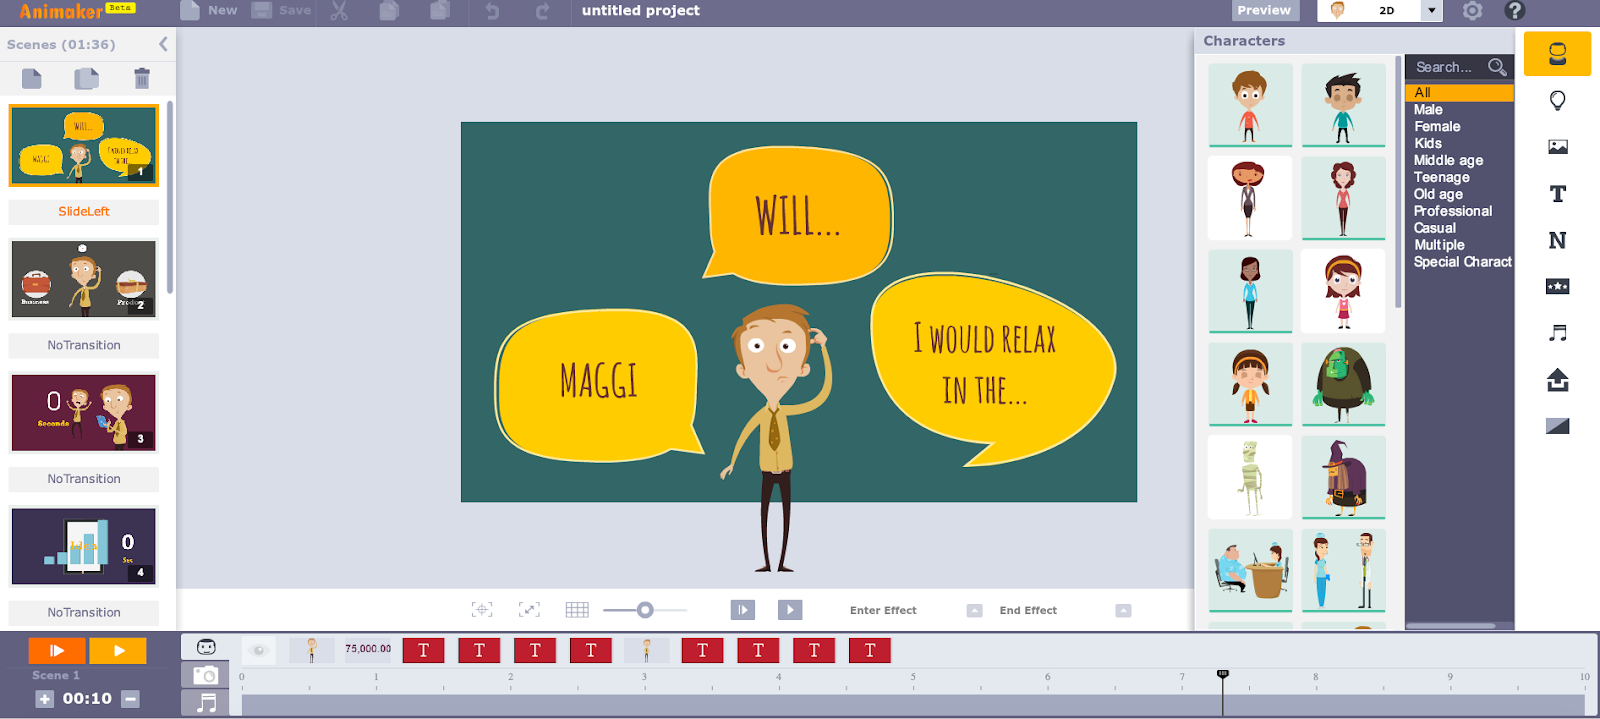
4. Animaker:
Animaker gives you a little more than just statistical infographics. If you are bored with doing what everyone else has been doing, then there is something for you.
Animaker is a tool that is used for making video infographics. It is said and has been observed that pictures help to understand better than text in some cases and then comes video presentation. It works ten times more than anything else does.
Animaker provides you with a vast range of resources, including charts, icons, and maps, to help you make your presentation much more fascinating and data easy to digest. You can create up to five two-minute SD videos for a month without having to pay anything for it, or you can upgrade to premium for more, longer, and higher quality video infographics.

5. Biteable
The final infographic tool that you should pay the most attention to is biteable. It is different from all the infographic tools you are used to using. Biteable allows you to create high-quality video presentations and share on YouTube Twitter and Facebook.
It provides a verity of images for creative people to work with. It also provides you with a music track to add to your video presentations. That elevates the impact your performance has. With premade designs and scenes at disposal, it allows you to convey your knowledge and statistics uniquely fully.
An actuary who works in one of the leading insurance organizations of London. He loves playing acoustic guitar and is adventurous.

 from any android mobile")
